Note
Click here to download the full example code
Control Amplitude Noise
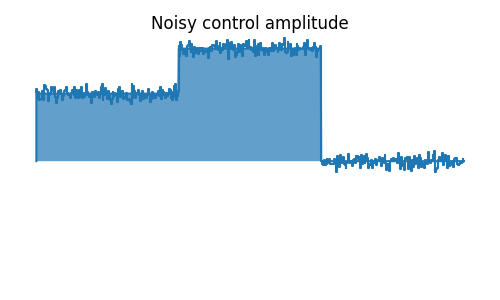
This example demonstrates how to add Gaussian noise to the control pulse.
Out:
[<matplotlib.lines.Line2D object at 0x7f24ea6622b0>]
import numpy as np
import matplotlib.pyplot as plt
from qutip.qip.device import Processor
from qutip.qip.noise import RandomNoise
from qutip.operators import sigmaz, sigmay

# add control Hamiltonians
processor = Processor(N=1)
processor.add_control(sigmaz(), targets=0)

# define pulse coefficients and tlist for all pulses
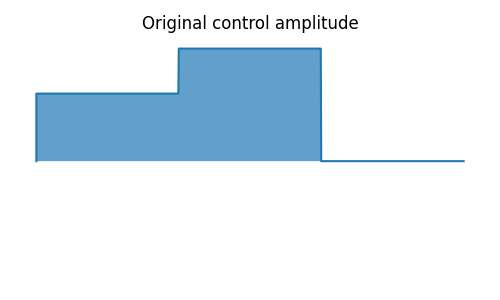
processor.pulses[0].coeff = np.array([0.3, 0.5, 0. ])
processor.set_all_tlist(np.array([0., np.pi/2., 2*np.pi/2, 3*np.pi/2]))

# define noise, loc and scale are keyword arguments for np.random.normal
gaussnoise = RandomNoise(
            dt=0.01, rand_gen=np.random.normal, loc=0.00, scale=0.02)
processor.add_noise(gaussnoise)

# Plot the ideal pulse
processor.plot_pulses(title="Original control amplitude", figsize=(5,3))

# Plot the noisy pulse
qobjevo, _ = processor.get_qobjevo(noisy=True)
noisy_coeff = qobjevo.to_list()[1][1] + qobjevo.to_list()[2][1]
fig2, ax2 = processor.plot_pulses(title="Noisy control amplitude", figsize=(5,3))
ax2[0].step(qobjevo.tlist, noisy_coeff)
Total running time of the script: ( 0 minutes 0.094 seconds)

