Note
Click here to download the full example code
T2 Relaxation
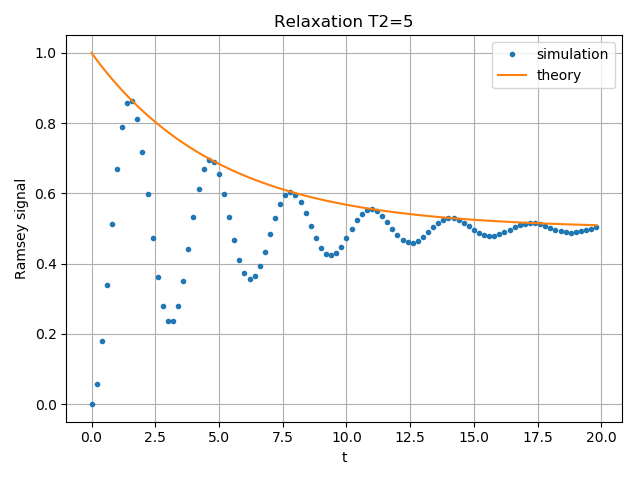
Simulating the T2 relaxation of a single qubit with qutip.qip.device.Processor. The single qubit is driven by a rotation around z axis. We measure the population of the plus state as a function of time to see the Ramsey signal.
import numpy as np
import matplotlib.pyplot as plt
from qutip.qip.device import Processor
from qutip.operators import sigmaz, destroy
from qutip.qip.operations import snot
from qutip.states import basis

a = destroy(2)
Hadamard = snot()
plus_state = (basis(2,1) + basis(2,0)).unit()
tlist = np.arange(0.00, 20.2, 0.2)

T2 = 5
processor = Processor(1, t2=T2)
processor.add_control(sigmaz())
processor.pulses[0].coeff = True
processor.pulses[0].tlist = tlist
result = processor.run_state(
    plus_state, e_ops=[a.dag()*a, Hadamard*a.dag()*a*Hadamard])

fig, ax = plt.subplots()
# detail about length of tlist needs to be fixed
ax.plot(tlist[:-1], result.expect[1][:-1], '.', label="simulation")
ax.plot(tlist[:-1], np.exp(-1./T2*tlist[:-1])*0.5 + 0.5, label="theory")
ax.set_xlabel("t")
ax.set_ylabel("Ramsey signal")
ax.legend()
ax.set_title("Relaxation T2=5")
ax.grid()
fig.tight_layout()
Total running time of the script: ( 0 minutes 0.119 seconds)